A week in the Black Rock Desert of Nevada at the end of summer may not sound like fun to many people. But tens of thousands — this year, 55,000 — make it an annual tradition by attending Burning Man, an arts festival and temporary city built by participants and operated under a gift economy and principles such as self-reliance, self-expression, and leave no trace behind.
The crowd is often stereotyped as anarchists, fire-lovers or drugged-out hippies who wear crazy costumes or nothing at all. More than a decade of Black Rock City census surveys conducted by festival participants, including newly released data from 2011, paint a much more complex picture.
The results show that all ages attend the festival — from babies to the elderly — and that typically more than half of participants who take the survey hold at least a bachelor’s degree. The most popular careers are in the computer and technology industries. (Click to view a graphical breakdown of education levels and career demographics.)
Men (54 percent) slightly edged out women (46 percent) at Burning Man in 2011. (Data from 2012 is not yet available). But the number of participants who identify themselves as female has been steadily growing; it was 34 percent in 2001, the first year of the survey.
One of the more interesting revelations: According to the 2011 survey results, nearly 16 percent of participants have lied or somewhat lied about attending the annual festival because they were ashamed.
One education graduate student at Stanford University is a two-time burner and falls into this category. “I told some professors that I was going off the grid, but didn’t say where or why,” said the student, who asked that his name not be used. “I didn’t want smarter, older, powerful people to look down on me. I also didn’t want their potential biases to affect my academic career.”
Participant George “Tinker” Jemmott said the instructors of a nursing prerequisite course at the City College of San Francisco asked him to defer taking the course because he was going to miss class for the event. “I almost lied about it,” Jemmott said. “If I had made up an excuse, I might have been able to keep the classes.”
One constant over the years of census data is the dominant presence of technology whizzes. John Lovejoy, 64, goes by the name “Lovetoy” at the festival, where nicknames are the norm. A burner for almost a decade, he used to work in the information technology industry and now sells insurance. He lives by what he says is an unspoken rule of Burning Man – you leave your career at home. At Burning Man, he can be part of a different kind of community. “I have nine brothers I’ve never had before,” Lovejoy said.
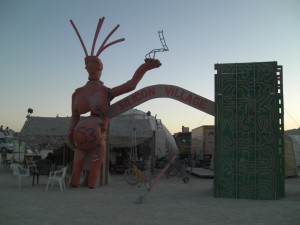
He camped with Silicon Village, an “electronics/tech camp,” along with 250 other people this year, most from the San Francisco Bay Area. “Sunshine,” who has a business degree from Harvard, invented and built “playa tech” — desert furniture that collapses flat for easy transportation; “Wristy” designed a tower with circuit boards on it; Rupert made a machine that produces margaritas with a simple pull of a switch. Lovejoy and his burner brothers meet year-round to lead workshops and learn skills together like hula hoop building.
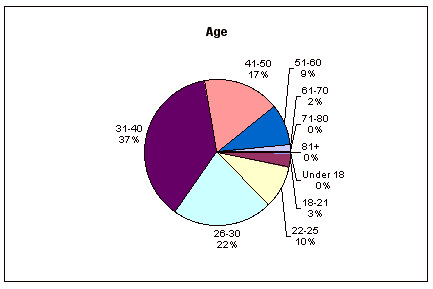
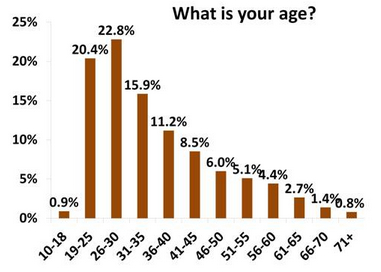
Participants span all generations, but survey results show that more young participants have been joining the Burning Man community in recent years. In 2003, more than half of survey-takers were between the ages of 31 and 50, while just over a third were 30 and under. By 2011, those two age groups more or less evened out, with the younger population slightly better represented than the older group. (Click to see a graphic showing the age demographics in 2003 and 2011.)
Yet last year, 50- to 70-year-olds comprised about 14 percent of survey-takers, up from 11 percent in 2003. It’s those in the middle — perhaps with children — who seem to be attending the festival less frequently, even though a few babies and toddlers do join the party every summer.
The wide age range might come as a surprise when you consider Burning Man camp conditions. Participants sleep in tents or RVs, huddle to keep warm in the 40-degree nights, and bake in the near 100-degree heat during the day. They use dust masks, goggles and scarves to protect themselves during wind storms, and if they want their hair to be temporarily free of dust, they have to find a camp that offers hair washing or steam baths as its community service, sometimes waiting up to 45 minutes in line.
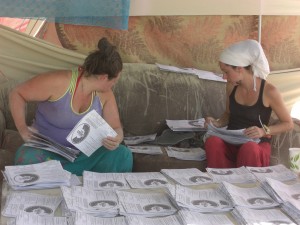
Surveying Burning Man’s population was the 2001 brainchild of “Maid Marian” Goodell, one of Burning Man’s six board members. Today, “Countess” S. Megan Heller, an anthropology graduate student at UCLA, manages the census.
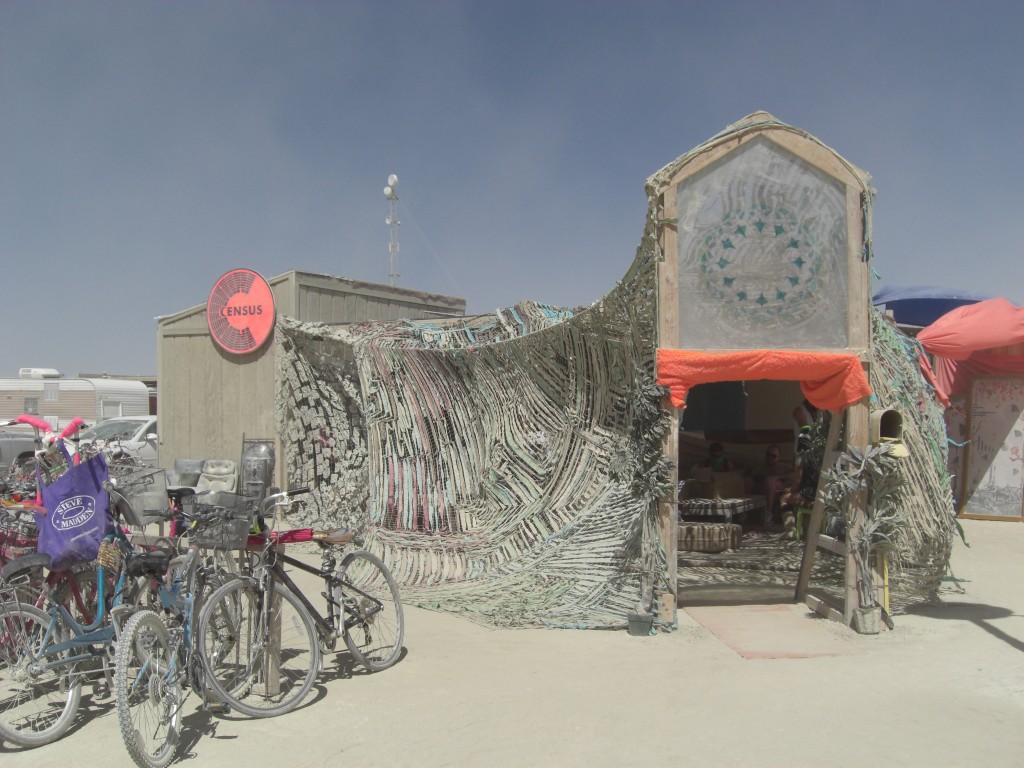
Heller coordinates an army of about 60 volunteers who distribute and collect census forms throughout the camps, wearing white lab coats and sometimes traveling on decorated vehicles. The survey gathers basic demographic information for the Burning Man Organization and also allows university professors and students to conduct research by adding questions such as: have you ever lied about attending Burning Man?; what is your favorite way to play at Burning Man?; and are you hoping to have a “sexy encounter” while there? This year’s research team collected data on urban planning, transportation, emotion regulation, play, gender issues and sexuality.
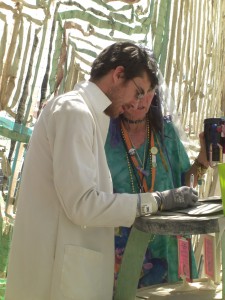
This research is important to Steven “Indiana” Crane, the volunteer coordinator. His love for “strategic thinking” brought him to the Black Rock City Census via a Stanford University summer research lab. During his four years at Burning Man, he has observed both millionaires and unemployed people who live “on the fringes of society,” and everyone in between. “Racial distribution is not so diverse,” he acknowledged, but a new random sampling this summer revealed that for 14 percent of the population English is not the first language.
The random sampling was done for the first time. Census takers approached more than 400 vehicles as they entered the festival, asking one person in each to fill out the survey. Their random sample garnered interesting results about participants’ political affiliation. Thirty-four percent reported themselves as Democrats, 33 percent as Independents and 24 percent as Republicans.
These numbers differ from the four previous surveys that asked about political affiliation — the last of which was issued in 2008 — in which Republican numbers were consistently less than 10 percent. The results show a relative equality across party lines at the stereotypically anarchist event. “This is the best data we have ever collected, because we used a random sample,” Heller said. “I would definitely say that these numbers are solid.”
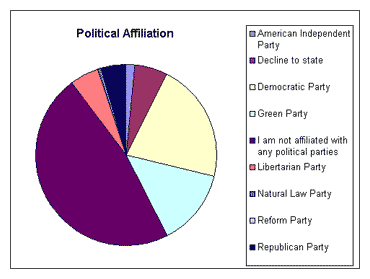
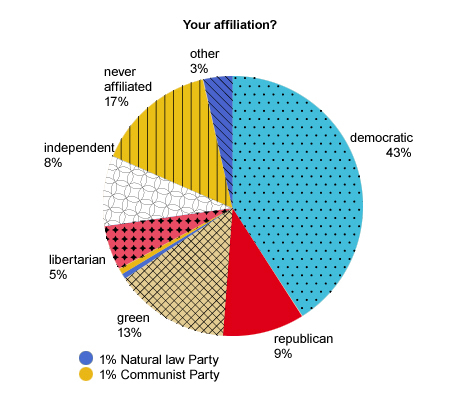
Over the past twelve years that the survey has been conducted, burners have become more politically affiliated in general. In 2001, nearly half of the census participants said they were not affiliated with any political party. In 2008, nearly half of participants said they were Democrats. Now, Democrats and Independents are equally represented at one third each of the surveyed population, and Republicans are quickly catching up. (Click to view graphics showing burners’ political affiliations in 2001 and 2008.)
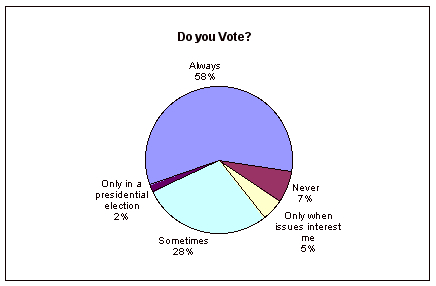
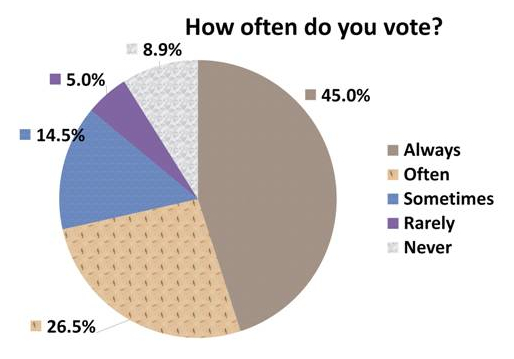
At the same time as they are affiliating themselves more with a particular party, today’s burners are apparently voting less. In 2003, 58 percent said they always vote compared to 45 percent in 2011. (Click to see a graphical representation of voting amongst burners in 2003 and 2011.)
The questions on the survey change slightly from year to year, so data collection is not always consistent, and results from the survey may not apply to the whole Burning Man community. This year, about 11,000 people took the survey, one fifth of the desert population.
Lynn and Norm Browne have been burners for over a decade and are also Black Rock City Rangers, who help to keep participants safe at the festival. They say some of the burners who have been coming for longer than they have are unhappy with how Burning Man is changing. “Some that have not gone since late 90s or early 2000, that’s exactly their complaint,” Norm said.
But he and Lynn argued that the burners of old are missing the point: Burning Man is not supposed to be the same every year. Norm explained, “It’s different every year. If you go expecting it to be one thing, then you’re probably going to be disappointed, whether it’s your first time or your tenth time. The whole point of going is to…experience there and then.”
As Lynn said, “You just have to let it happen.”
You can access all survey data at afterburn.burningman.com.
Peninsula Press reporter Xandra “Isis” Clark wrote this article after participating in Burning Man this summer.


